Zeneca Data
Explore this section to deepen your understanding of the research that’s connected with this Superfund-qualified site on Richmond’s shoreline.
Federal & State Agencies
-
Zeneca (Camous Bay) Progress Report to RSSA CAG
Arcadis (for Zeneca, Inc.)
-
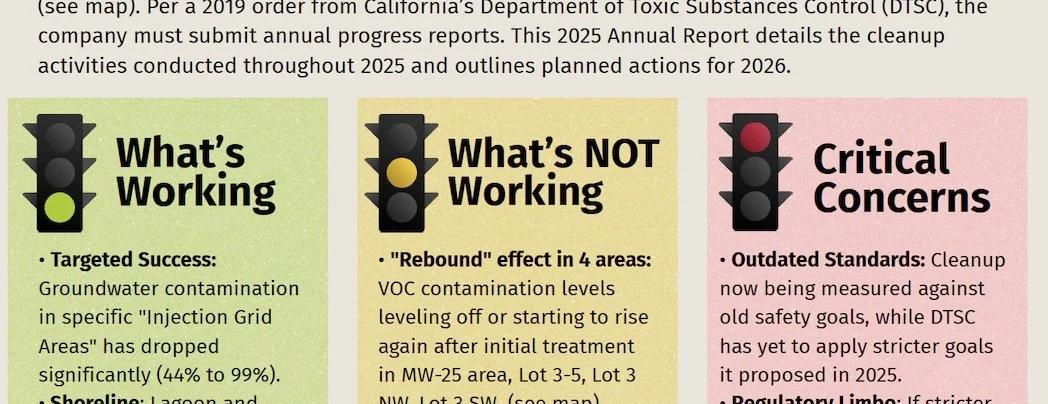
2025 Zeneca Annual Monitoring Report
Arcadis (for Zeneca, Inc.)
-

Envirostor Homepage for Zeneca Site
California Department of Toxic Substances Control
-

Biomarkers of Exposure, Effect, and Reproductive Impairment (2001-2005)
U.S. Environmental Protection Agency
-

Chemicals Subject to Community Planning and Community Right to Know
U.S. Environmental Protection Agency
-
![Several people working on their laptops in an office.]](https://images.squarespace-cdn.com/content/v1/67466b8557daa354675fcda0/1738552254097-VGV78194JB00HAVCD6P8/unsplash-image-5fNmWej4tAA.jpg)
Zeneca Superfund Site ID Number
U.S. Environmental Protection Agency
-

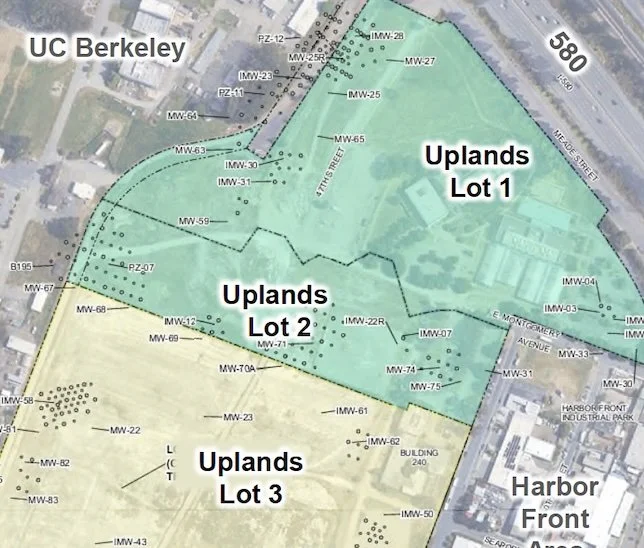
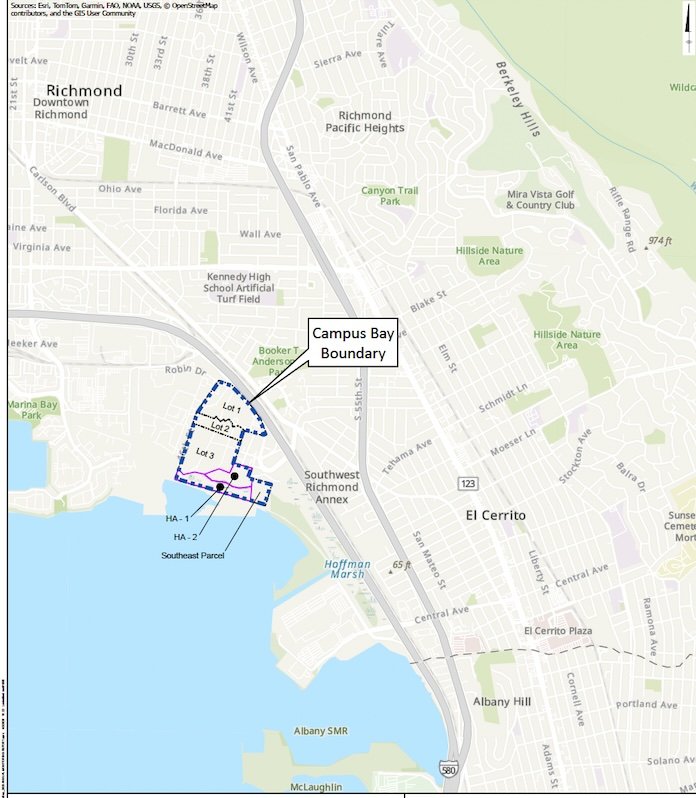
Approved Zeneca Feasibility Study/Remedial Action Plan (2019)
California Department of Toxic Substances Control
-

TCE Human Health Risk Evaluation (2012)
California Department of Toxic Substances Control
-

Public Health Assessment for Zeneca/Campus Bay (2009)
Prepared by ATDSR for California Department of Public Health
-
RSSA CAG Technical Team re Increased Gamma Reading (2008)
Richmond Southeast Shoreline Alliance Community Action Group

Local Agencies & Groups
-
Zeneca Community Fact Sheet (created for April 9, 2026 meeting)
Richmond Shoreline Alliance
-
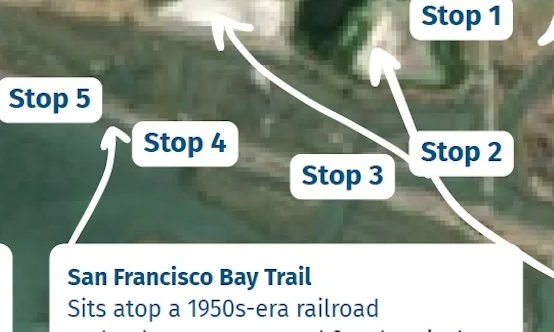
Zeneca Toxic Tour Guide
Richmond Shoreline Alliance (March 2026)
-
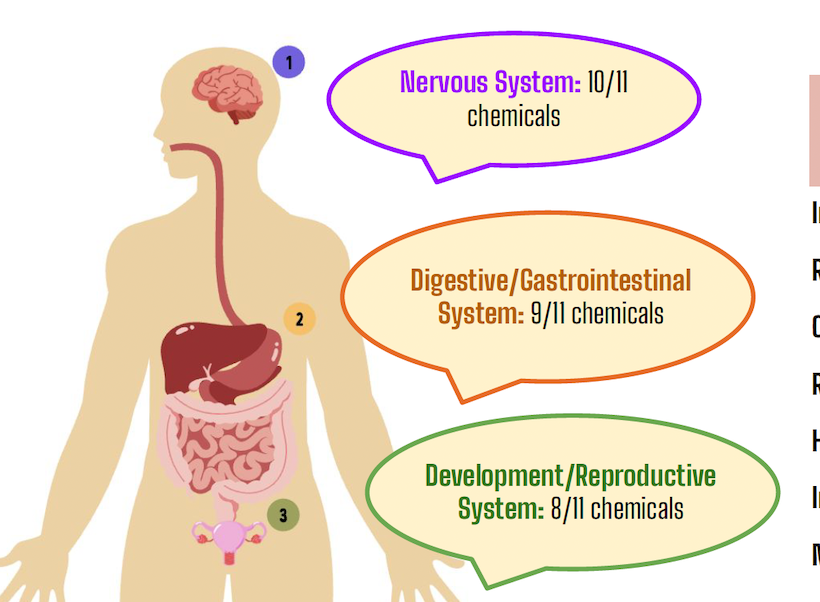
Zeneca Chemicals:Brief Summary of Their Health Effects
Debbie Adam & Richmond Shoreline Alliance (November 2025)
-

Toxic Tales: The Zeneca Site
Richmond Shoreline Alliance (October 2025)
-

Zeneca Cleanup Infographic
Martin Hamann & Richmond Shoreline Alliance (July 2025)
-

Community Guide to the Zeneca Cleanup
Martin Hamann & Richmond Shoreline Alliance (July 2025)
-

Ticking Time Bomb: Shoreline Contamination 2023 (Case Study 49)
Greenaction
-

PCB Spatial Patterns in San Francisco Forage Fish (2012)
San Francisco Estuary Institute
-

Endocrine Disruption in a Salt Marsh Fish (2005)
Pacific Estuarine Ecosystem Indicator Research Consortium
Miscellanous
-
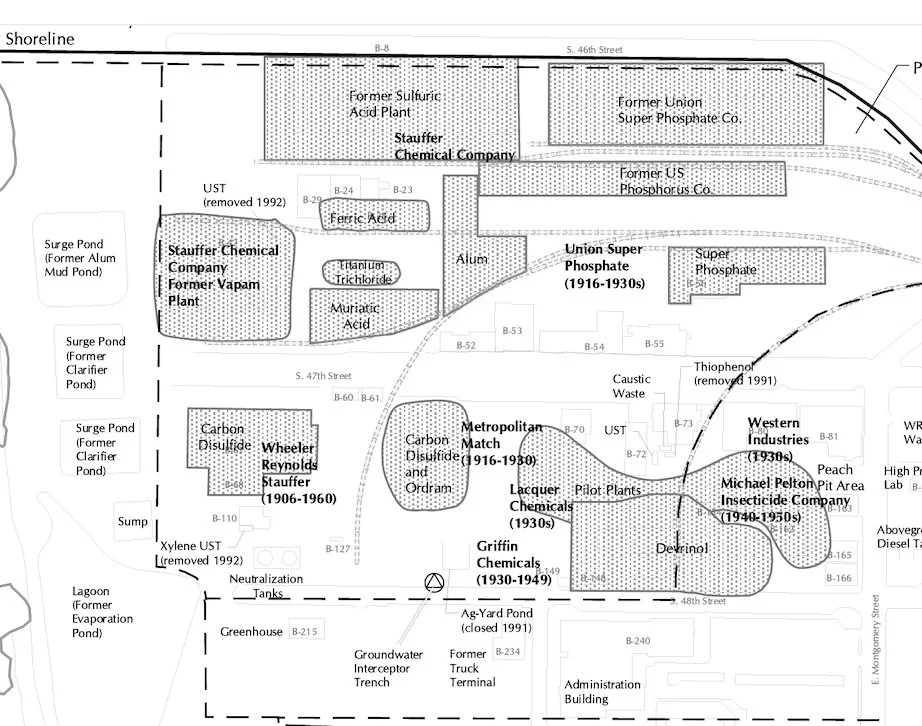
Zeneca Phase II Investigation Report (2000)
Levine-Fricke (for Zeneca Inc.)